Carbon emissions for East Herts have reduced by about 30% over the last decade, mostly because less of our electricity is from coal-fired power stations, and more is generated from gas and from wind and solar power. But electricity is only part of the problem – we now need to reduce emissions from heating and transport too.
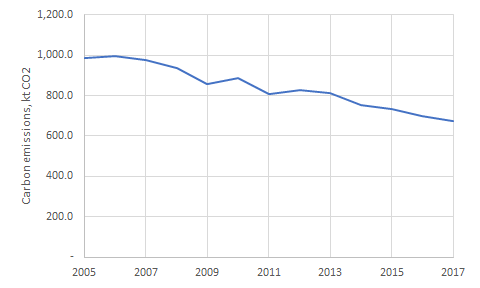
Over the last twelve years, the total carbon emissions for East Herts have reduced by about 30% from around 1,000 kt CO2 (kilo-tonnes of carbon dioxide) per year to 675 kt CO2 1. This is mostly because less of our electricity is from coal-fired power stations, and much more electricity is generated from gas, a cleaner fuel but still with carbon emissions, and from renewable sources such as wind power, solar photovoltaics and bio-energy. This is an amazing achievement, but electricity only account for 35% of our total energy consumption 2.
These statistics don’t include the impacts of other greenhouse gases such as methane and also don’t include include the emissions from air flights or from the things that we buy (unless they’re also produced in East Herts). The carbon emissions for imported goods are another large factor on top of the figures here.
Domestic, commercial and transport
Breaking the total emissions down into separate categories for domestic, commercial and road transport, we see that the domestic and commercial emissions in East Herts have both reduced. The transport emissions, largely road transport, were reducing slowly until 2013 but are now going up again.
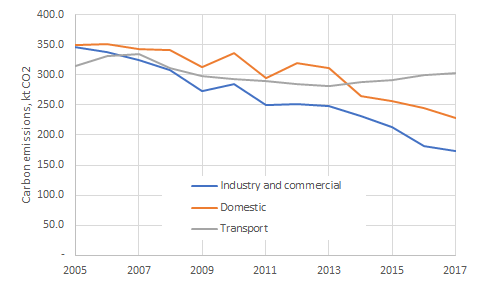
(The figures in the graph above add up to slightly more than the totals in the first graph which include a reduction due to the overall carbon sink effect of land use such as in woodlands and grassland.)
Domestic carbon emissions
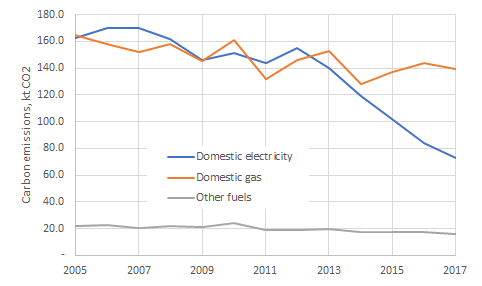
The domestic sector emissions includes the use of electricity, gas and other fuels. Emissions due to electricity use have fallen sharply. This is partly because domestic customers use less electricity now, falling nationally by 16% between 2005 and 2017 3, but mostly because our electricity production has shifted away from coal-fired generation. We now have a much higher proportion of electricity generated at gas-fired power stations and an increasingly large share from renewable energy. Most of the renewable generation is from wind power but there is a steady increase in the output from solar photovoltaics and from bio-energy 4 .
Emissions from domestic gas for heating and hot water have reduced by 15% from 2005 to 2017, due to improvements in insulation and heating efficiency, and some warmer winters 5. This is good, but we need much faster reductions in carbon emissions than this to get to net-zero carbon emissions by 2030. This means we need to:
- Improve insulation so that less heating is needed
- Change gas boilers to electric heat pumps so that heating is much more efficient (heat pumps work by moving heat to where it’s needed, rather than by burning fuel)
- Install renewable generation on buildings to minimise the net energy consumption
Industrial and commercial emissions
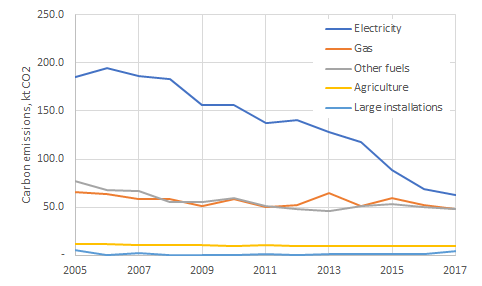
Industrial and commercial carbon emissions in East Herts show a similar trend as the domestic emissions with a major reduction relating to electricity generation. Nationally, the industrial demand for electricity dropped by around 13% at the time of the financial crisis in 2008, with further reductions since then. Again, the carbon emissions for electricity generation are lower as coal-fired generation has reduced and renewable energy has increased. We now need similar reductions in the industrial use of natural gas and other fuels.
Carbon emissions across Hertfordshire
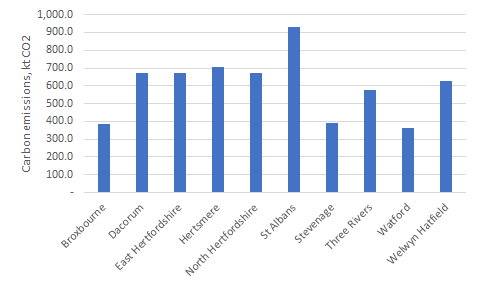
Carbon emissions in East Herts are higher than in all but two of the other districts, Hertsmere and St Albans. This is partly because East Herts has a higher population; the emissions per person in East Herts are close to the average across the county. It might be argued that we should have divided the total emissions by the number of people when plotting the graph below.
But it’s the total emissions that count, and the net emissions in all districts need to get to zero. By 2021, East Herts is expected to be the second most populated district in Hertfordshire 6 and so decisions made here, such as on housing energy efficiency, affect a larger share of the total emissions from the county than in most of the other districts.
References
- https://www.gov.uk/government/statistics/uk-local-authority-and-regional-carbon-dioxide-emissions-national-statistics-2005-to-2017
- https://www.gov.uk/government/statistics/energy-consumption-in-the-uk
- https://assets.publishing.service.gov.uk/government/uploads/system/uploads/attachment_data/file/820722/DUKES_5.1.2.xls
- https://interactive.carbonbrief.org/how-uk-transformed-electricity-supply-decade/
- https://www.carbonbrief.org/analysis-why-the-uks-co2-emissions-have-fallen-38-since-1990
- http://atlas.hertslis.org/profiles/profile?profileId=1051&geoTypeId=16&geoIds=E10000015##